Ally Financial
Background
Ally offers a variety of financial planning tools to help customers estimate mortgage payments, affordability, and refinancing costs. However, these calculator tools had an outdated design system and missed key features needed for users early in the homeownership process.
My role: UX Designer
Skills: Wireframing, Prototyping, Competitive Research
Project challenge
The affordability calculator was outdated, and some functionality felt hidden from users. For first-time homebuyers, users had questions and didn’t have enough context to feel comfortable moving forward to the loan application process.
Problem statement
How might we provide a comprehensive view of users’ finances and empower them to become homeowners?
Goals
- Give more prominence to information that felt hidden
- Use clear indicators for results that fall within, stretch, or exceed a user’s budget
- Modernize the UI to match the current Ally Design system
- Ensure the new design provides an accessible experience to all users
- Provide a visual connection between the input fields and the loan breakdown
Challenges
- Complexity
- Giving enough context for the user without being overwhelming
- Balancing information between desktop and mobile users
- Providing value for both first-time homebuyers and current homeowners
- Development
- The back-end formula used in the calculator required constant communication between design and development
- Creating design solutions for patterns that hadn’t been accounted for before this project
Wireframes
Based on what I knew about the user’s needs, I had several starting points for what to include in wireframes.
- Contextual help modals and tooltips explaining terms.
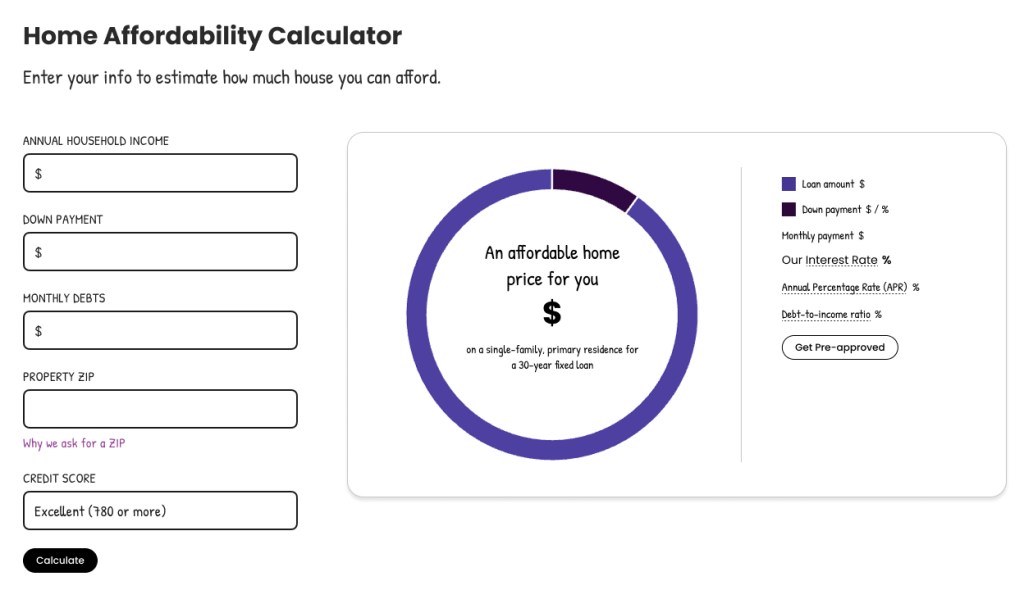
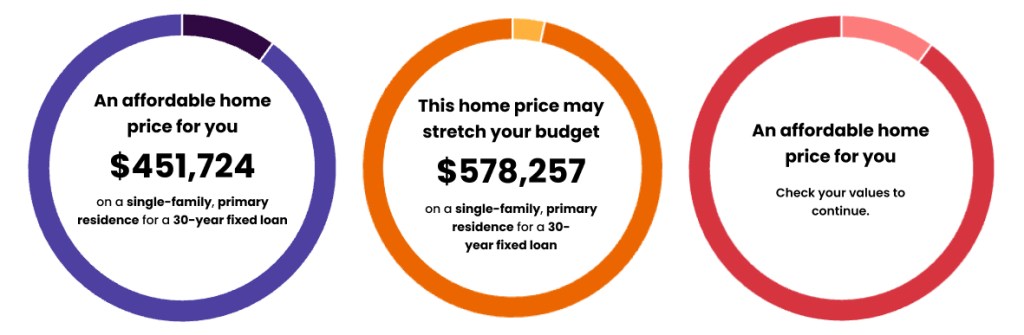
- A card background around the donut chart gave more visual hierarchy between the input fields and results.
- Show when a home price will be within a user’s budget or when it will go beyond their price range.
- Keep the donut chart and inputs on the same side of the page throughout the experience. Previously, the illustration on the right side of the page was replaced by the chart, but this animation caused confusion for users with screenreaders.
User Testing
User interviews were conducted after the participants performed several prototype tasks. The user testing was unmoderated, using an Axure prototype of the tool.
These tasks included:
- Interacting with the input fields
- Calculating an example scenario
- Locating the monthly payment modal and giving feedback on presentation
- Finding more homebuying resources on the page
Participants were divided into desktop and mobile, with the same tasks being researched to test functionality. Many users were first-time homebuyers, which helped provide insight into how someone unfamiliar would navigate the calculator.
Positive findings:
- Users were delighted by the design overall and thought the tool would be helpful for them in their future home search
- The layout felt easy to understand
- Contextual help gave users insight into terms they didn’t have prior knowledge on
Feedback I incorporated into the next version:
- Homebuying terms
- Being first-time homebuyers, some users were confused by terms like ‘HOA’.
- To prevent confusion on terminology, we addressed common loan terms with more contextual help.
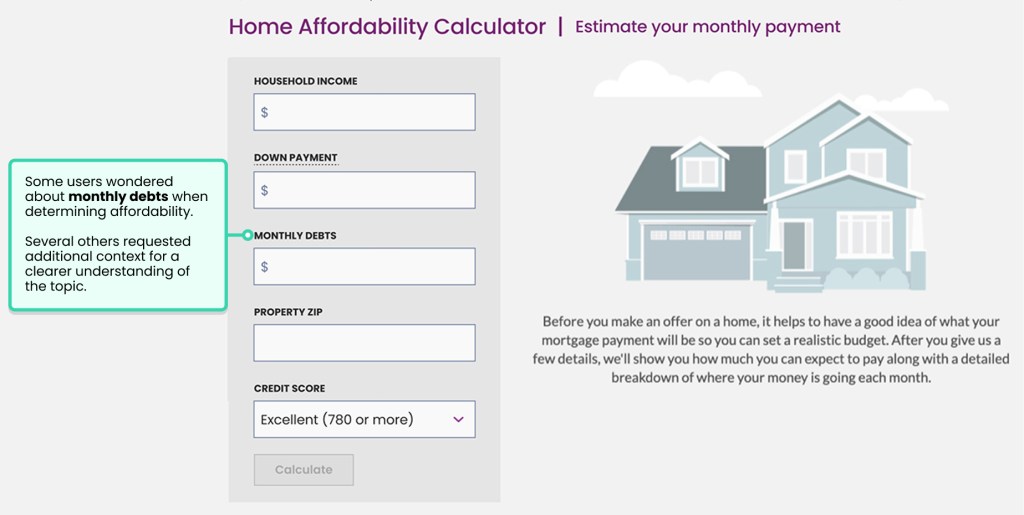
- Monthly debts
- Some users felt confused about what expenses to include in monthly debts.
- To provide more context, we created a modal explaining the different types of monthly debts the user needed to consider.

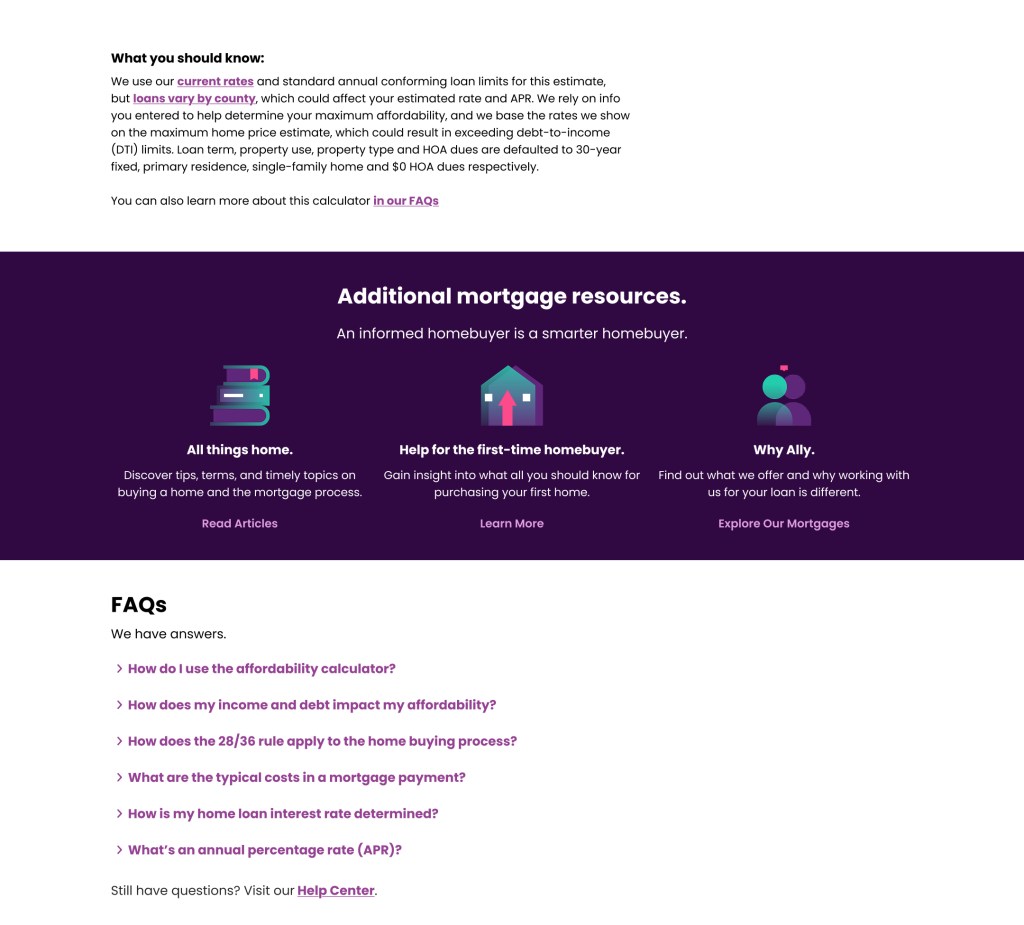
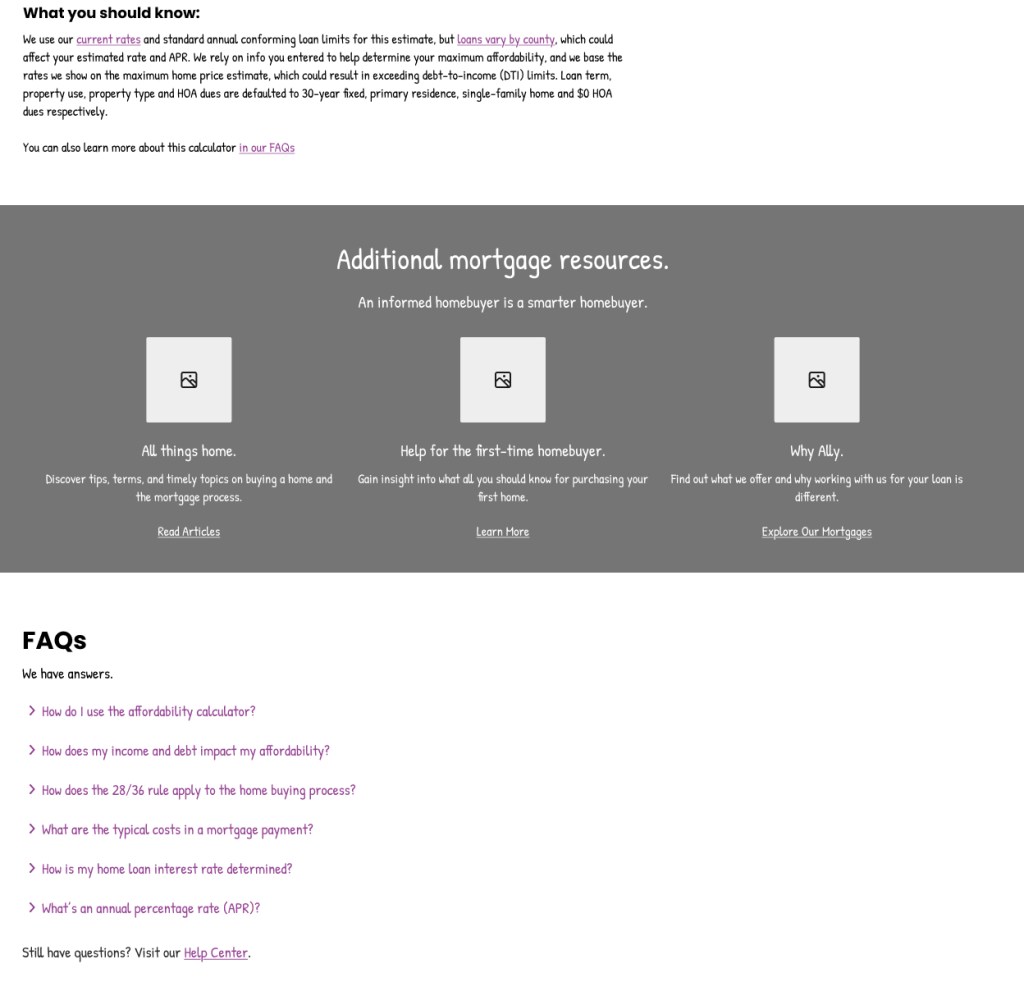
- Homebuying resources
- More pages and resources were linked below the calculator to support customers at any stage of their journey.
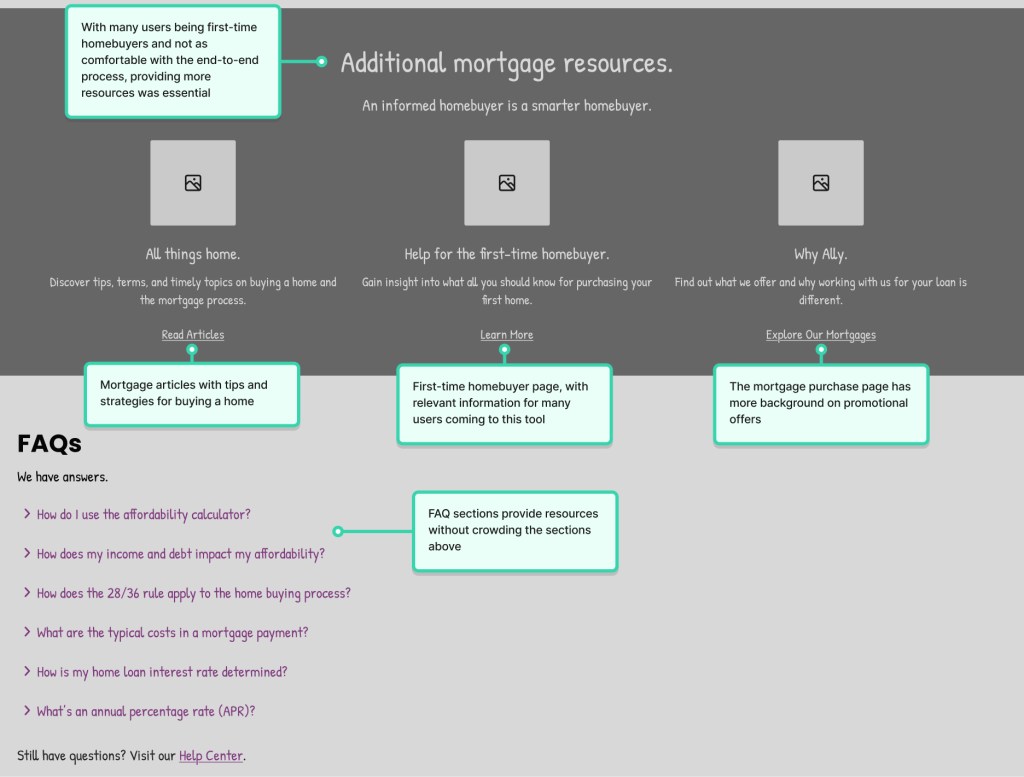
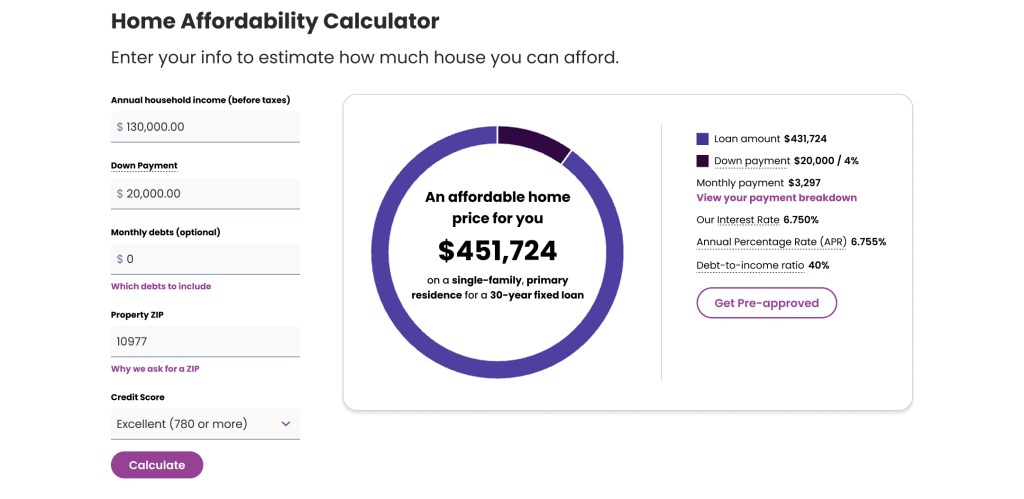
Final Design
The new version of the calculator addressed previous accessibility and usability concerns and gave a visual refresh. User feedback gave me valuable insight into which terms needed more background information, and what first-time homebuyers would want to know when they first land on the page.